What BMI Is, and What It Was Designed For
Body mass index (BMI) is a single number that relates your weight to your height. It was developed in the 1830s by the Belgian mathematician Adolphe Quetelet, not as a health tool, but as a way to describe the "average man" in population statistics. It only became a medical screening measure in the 1970s, when researchers found it correlated reasonably well with body fat across large groups of people.
That origin explains almost everything about BMI's strengths and weaknesses. It's excellent at describing populations. It's much rougher at describing an individual.
A BMI calculator does one thing: it applies a formula to your height and weight and places the result in a category. The formula itself is trivial. Interpreting the result is where people go wrong.
The BMI Formula
Metric: BMI = weight (kg) ÷ height (m)²
Imperial: BMI = [weight (lb) ÷ height (in)²] × 703
Worked example
A person who weighs 78 kg and is 1.75 m tall:
1.75 × 1.75 = 3.0625 78 ÷ 3.0625 = 25.5
That places them just inside the "overweight" category. Whether that label means anything for this specific person is a separate question, which we'll get to.
Why height is squared
Quetelet observed that among adults, weight tends to scale roughly with the square of height, not the cube. Squaring height produces a number that stays reasonably stable across short and tall people. It's an empirical fit, not a law of physics, and it slightly penalizes tall people (who tend to get higher BMIs at the same body fat) and flatters short people.
BMI Categories (WHO Classification)
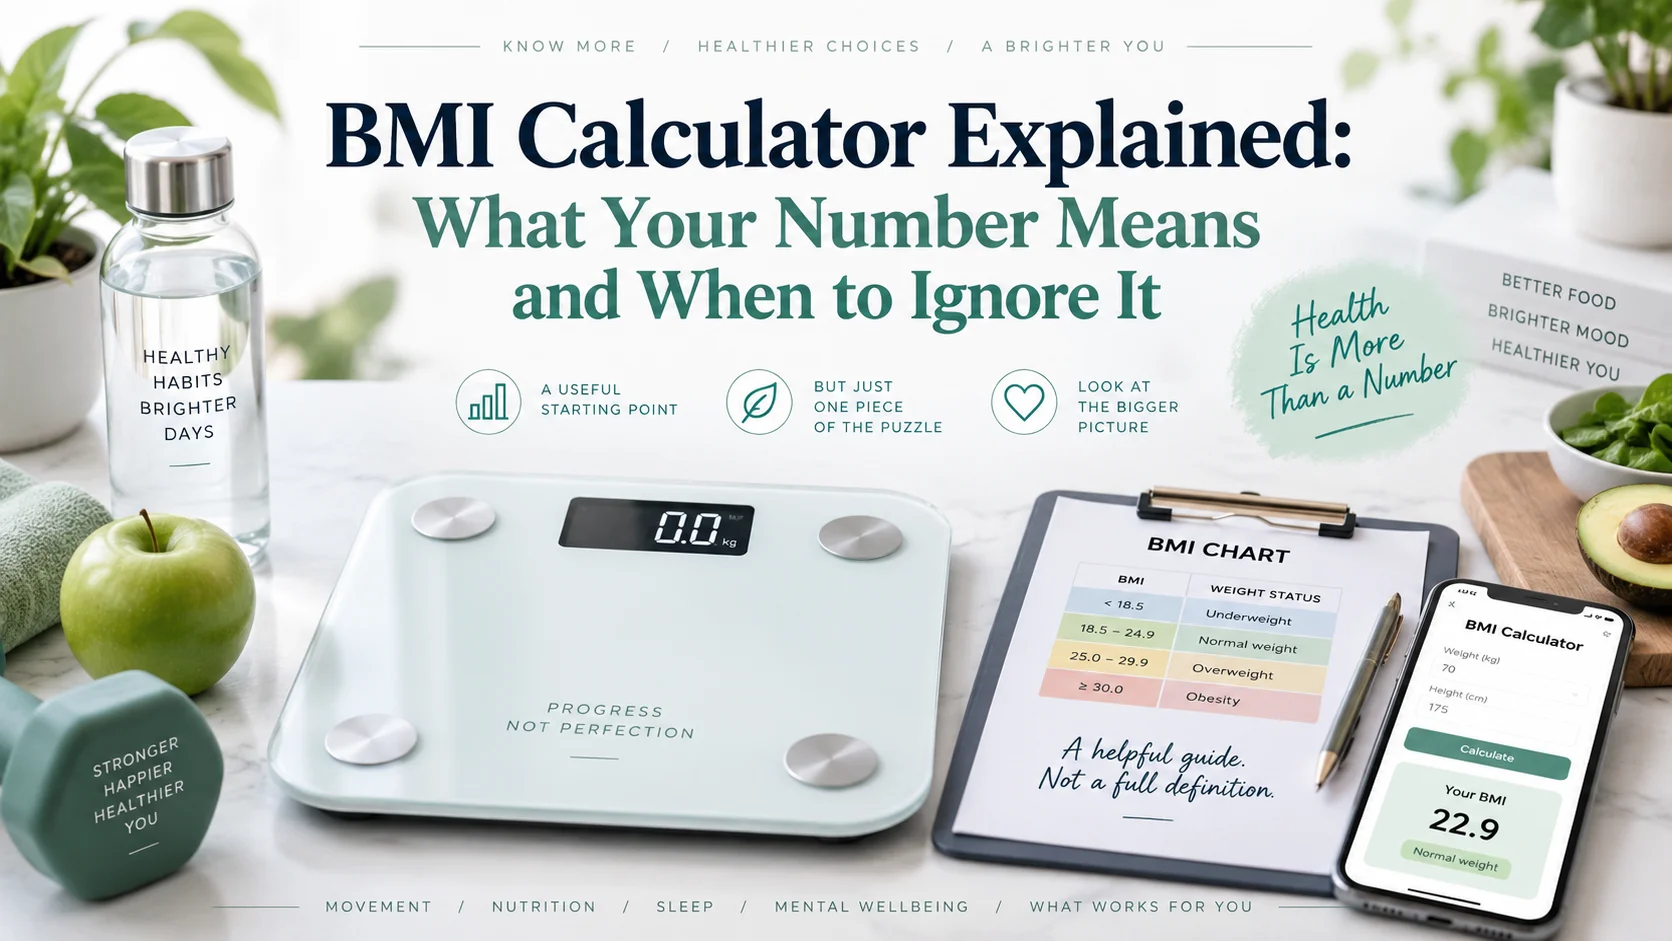
The World Health Organization's classification for adults is the one used by nearly every calculator:
| Category | BMI range |
|---|---|
| Underweight | below 18.5 |
| Normal weight | 18.5 – 24.9 |
| Overweight | 25.0 – 29.9 |
| Obesity class I | 30.0 – 34.9 |
| Obesity class II | 35.0 – 39.9 |
| Obesity class III | 40.0 and above |
These cutoffs are round numbers chosen for convenience. There is no biological switch at 25.0; risk rises gradually across the range.
Quick reference chart
BMI for common heights, so you can locate yourself without a calculator:
| Height | BMI 18.5 | BMI 25 | BMI 30 |
|---|---|---|---|
| 1.60 m | 47 kg | 64 kg | 77 kg |
| 1.65 m | 50 kg | 68 kg | 82 kg |
| 1.70 m | 53 kg | 72 kg | 87 kg |
| 1.75 m | 57 kg | 77 kg | 92 kg |
| 1.80 m | 60 kg | 81 kg | 97 kg |
| 1.85 m | 63 kg | 86 kg | 103 kg |
| 1.90 m | 67 kg | 90 kg | 108 kg |
The "normal" window for a 1.75 m adult spans 57 to 77 kg, a 20 kg range. That width is the first hint that BMI is a coarse instrument.
Different Cutoffs for Different Populations
The WHO thresholds were derived largely from European and North American data. Research has since shown that the relationship between BMI and body fat, and between BMI and disease risk, varies across ethnic groups.
A 2004 WHO expert consultation published in The Lancet concluded that people of Asian descent tend to have higher body fat and higher risk of type 2 diabetes and cardiovascular disease at lower BMIs. Several countries and health bodies now use lower action points for Asian populations:
| Category | Standard (WHO) | Asian populations (commonly used) |
|---|---|---|
| Overweight | 25.0 | 23.0 |
| Obese | 30.0 | 27.5 |
In the UK, the National Institute for Health and Care Excellence (NICE) recommends the 23 / 27.5 thresholds for people of South Asian, Chinese, other Asian, Middle Eastern, Black African or African-Caribbean background. If a calculator only offers one set of categories, it may be understating risk for a large part of the population.
BMI for Children and Teenagers
Adult categories don't apply to anyone under 20. Children's body fat changes dramatically with age and differs between boys and girls, so BMI in children is expressed as a percentile relative to others of the same age and sex, using growth charts from the CDC or WHO.
| Category | Percentile |
|---|---|
| Underweight | below 5th |
| Healthy weight | 5th to below 85th |
| Overweight | 85th to below 95th |
| Obesity | 95th and above |
A 10-year-old with a BMI of 20 might be at the 85th percentile; the same BMI in a 17-year-old is close to the median. A standard adult BMI calculator gives meaningless results for children, and any reading should come from a pediatric chart.
What BMI Gets Right
It's easy to dismiss BMI, but it persists for good reasons.
- It correlates with body fat at the population level. Across thousands of people, higher BMI generally means higher body fat. Studies comparing BMI with DEXA scans find correlations of roughly 0.7–0.8 in adults.
- It predicts risk at the population level. A 2016 analysis of 239 studies covering 10.6 million people, published in The Lancet by the Global BMI Mortality Collaboration, found mortality risk was lowest at a BMI of roughly 20–25 and rose progressively above that in every region studied.
- It's free and instant. No equipment, no training, no lab. That's why doctors and public health systems use it as a first filter.
BMI works as a screening tool: a way of flagging who might benefit from a closer look. The mistake is treating the screening result as the diagnosis.
Where BMI Fails
It can't tell muscle from fat
This is the famous limitation, and it's real. A 90 kg man at 1.80 m has a BMI of 27.8 whether he's a rugby player at 12% body fat or a sedentary office worker at 30%. Both are "overweight" on the chart; only one of them has excess fat.
The effect is largest in people who train seriously with weights, in certain athletes (rugby, American football, wrestling, throwing events), and in people with naturally heavy frames. We look at this group specifically in why BMI misleads athletes.
It can't tell where fat is stored
Two people with identical BMIs can have very different health profiles depending on whether their fat sits under the skin or around the organs. Visceral fat, the kind packed around the liver and intestines, is far more strongly linked to insulin resistance, heart disease and type 2 diabetes than subcutaneous fat. BMI is blind to this, which is why waist measurements are such a useful companion.
It misclassifies older adults
Muscle mass declines with age. An older adult can have a "normal" BMI while carrying a high percentage of body fat and very little muscle, a condition sometimes called sarcopenic obesity. At the other end, some research suggests that for adults over about 65, a BMI slightly in the "overweight" range is associated with equal or lower mortality than the "normal" range, likely because a modest reserve offers protection during illness. We cover this in what counts as a healthy BMI by age.
"Normal-weight obesity" is more common than people think
Someone can have a BMI of 23 and a body fat percentage of 33%. Studies using DEXA have found that a meaningful share of adults with a "normal" BMI carry body fat levels associated with metabolic risk. BMI will tell these people everything is fine.
It doesn't distinguish men from women
Women naturally carry more body fat than men at the same BMI, roughly 8–10 percentage points more, because of essential fat linked to reproductive biology. A single set of categories for both sexes glosses over this, which we unpack in BMI for women vs men.
Better Measures to Use Alongside BMI
None of these replace BMI entirely; each fills one of its gaps.
Waist circumference
The simplest fix for BMI's biggest blind spot. Measure at the level of the navel, relaxed, after breathing out. Commonly used risk thresholds:
| Increased risk | Substantially increased risk | |
|---|---|---|
| Men | 94 cm+ | 102 cm+ |
| Women | 80 cm+ | 88 cm+ |
Lower thresholds (90 cm for men, 80 cm for women) are often recommended for Asian populations.
Waist-to-height ratio
Divide your waist circumference by your height, both in the same units. A ratio below 0.5 is generally considered low risk for most adults, which gives a rule of thumb that fits on one line: keep your waist under half your height. Several studies have found waist-to-height ratio predicts cardiometabolic risk better than BMI alone, and NICE now recommends using it alongside BMI.
Body fat percentage
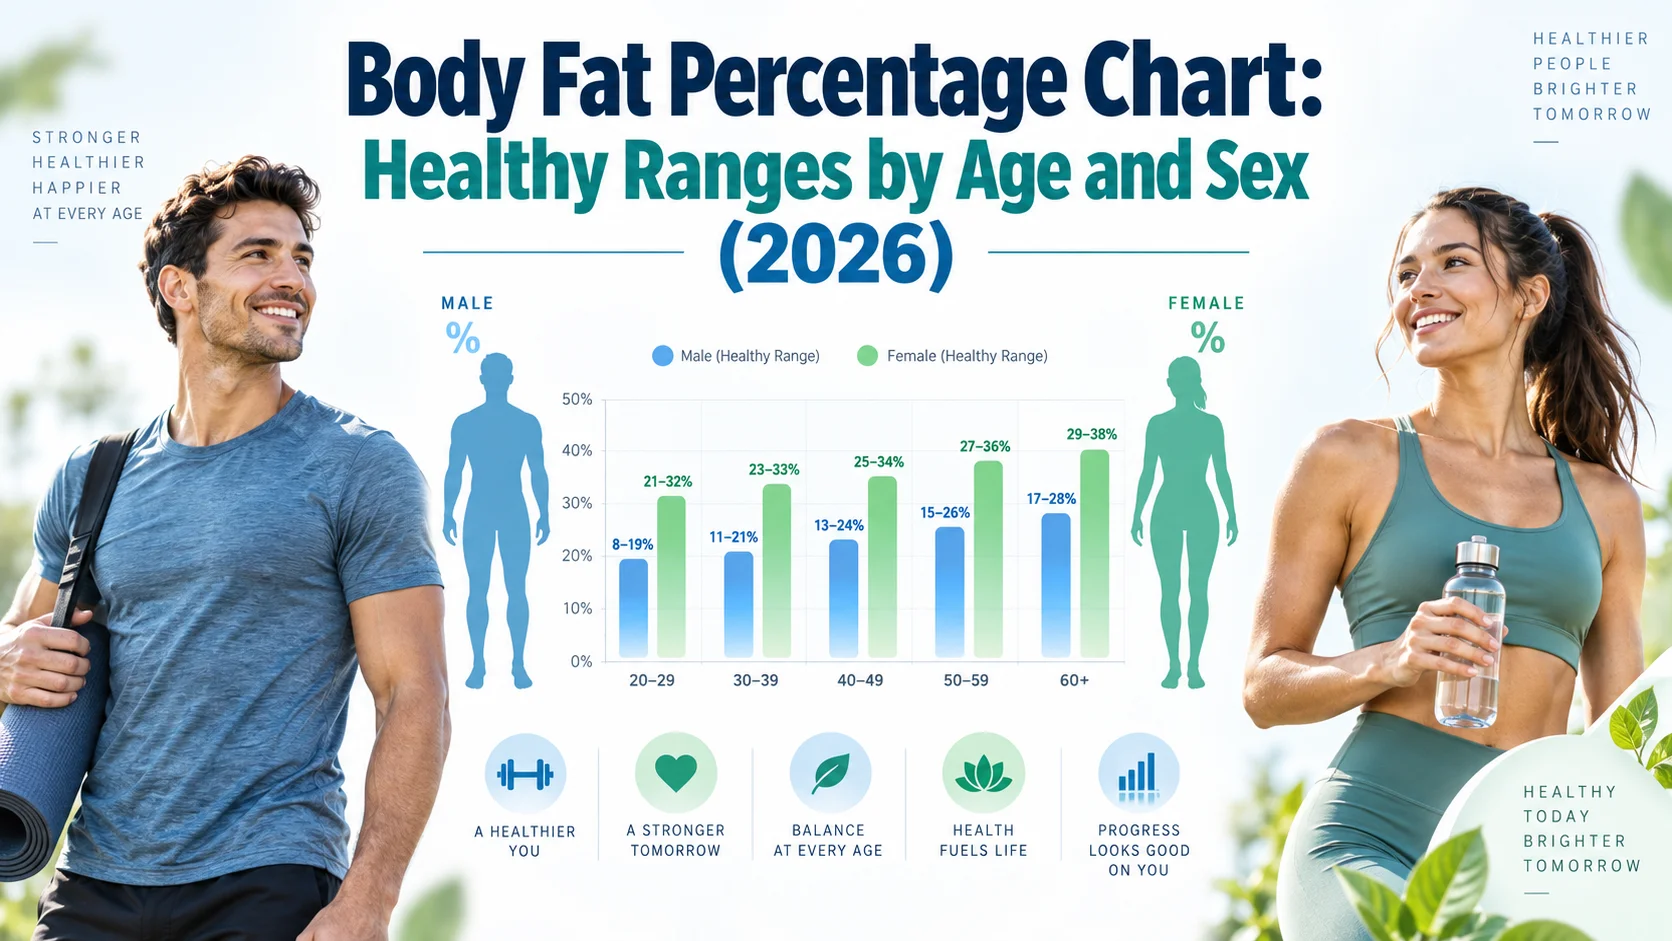
The direct measure of what BMI is trying to estimate. It requires a tool (DEXA, calipers, a tape-measure formula, or a bioelectrical impedance scale) and every method has error, but it separates fat from lean mass in a way BMI never can. Our body fat percentage chart gives the healthy ranges by age and sex, and we compare the two measures head-to-head in BMI vs body fat percentage.
How to combine them
For most adults, a practical combination is:
- BMI as the first screen
- Waist-to-height ratio to check fat distribution
- Body fat percentage if you train regularly or want to track composition changes over time
If all three agree, you have a clear picture. If BMI says "overweight" but the other two are fine, the BMI is probably reading muscle. If BMI says "normal" but the waist ratio is above 0.5, that's worth paying attention to.
Using BMI as a Goal (Carefully)
BMI is a reasonable way to set a broad target if you don't have other data. Someone at a BMI of 32 who wants to reach a healthy range can work backwards from the formula: at 1.70 m, a BMI of 24.9 corresponds to about 72 kg.
Two cautions. First, the lower end of "normal" is not automatically better than the upper end; the mortality data suggests the sweet spot is closer to 21–25 than to 18.5. Second, what you lose matters as much as how much. Losing 15 kg of mostly fat and losing 15 kg of half fat and half muscle produce the same BMI and very different outcomes.
That second point is why tracking what you eat, especially protein, tends to matter more for results than tracking your BMI. Consistent food logging is one of the best-supported habits in weight management research, and it has become far less tedious: photo-based apps like CalSensei estimate calories and macros from a picture of your meal, which removes most of the friction that makes people stop after a week. Pair a moderate calorie deficit with adequate protein and resistance training, and the weight that comes off is mostly the weight you wanted to lose.
Frequently Asked Questions
What is a healthy BMI?
For most adults, 18.5 to 24.9 by the WHO classification, with large population studies finding the lowest mortality around 20 to 25. For people of Asian descent, action thresholds are often set lower, at 23 for overweight and 27.5 for obese.
Is BMI accurate?
It's accurate for what it measures, the ratio of weight to height squared. It's a rough proxy for body fat that works well across populations and less well for individuals, especially athletes, older adults and people with unusual body proportions.
Can you be overweight by BMI but healthy?
Yes. People with high muscle mass frequently have a BMI in the overweight range with low body fat and no metabolic issues. Waist-to-height ratio and body fat percentage usually clear up the picture.
Can you have a normal BMI and still be unhealthy?
Yes. A normal BMI with a high body fat percentage or a waist-to-height ratio above 0.5 is associated with elevated metabolic risk. This is sometimes called normal-weight obesity.
Does BMI apply to children?
Not in adult form. Children's BMI is interpreted as an age- and sex-specific percentile using growth charts, not the adult categories.
Should I use BMI or body fat percentage?
Use BMI as a quick screen and body fat percentage, or at least waist-to-height ratio, for a more complete view. BMI is fastest; body fat percentage is more informative if you can measure it consistently.
Why does my BMI say overweight when I look fine?
Most often because you carry more muscle than the average person the chart was built on. Check your waist-to-height ratio; if it's under 0.5, the BMI is probably reading lean mass rather than fat.
This article is for general educational purposes and is not a substitute for individualized medical advice. BMI is a screening tool, not a diagnosis. If you have concerns about your weight or health, consult a qualified healthcare professional.
Sources
- World Health Organization. Body mass index (BMI) classification and A healthy lifestyle – WHO recommendations.
- WHO Expert Consultation. Appropriate body-mass index for Asian populations and its implications for policy and intervention strategies. The Lancet, 2004.
- The Global BMI Mortality Collaboration. Body-mass index and all-cause mortality: individual-participant-data meta-analysis of 239 prospective studies in four continents. The Lancet, 2016.
- National Institute for Health and Care Excellence (NICE). Overweight and obesity management guideline (NG246), 2025.
- Centers for Disease Control and Prevention. About Child and Teen BMI.
- Ashwell M, Gunn P, Gibson S. Waist-to-height ratio is a better screening tool than waist circumference and BMI for adult cardiometabolic risk factors: systematic review and meta-analysis. Obesity Reviews, 2012.
- Romero-Corral A, et al. Normal weight obesity: a risk factor for cardiometabolic dysregulation and cardiovascular mortality. European Heart Journal, 2010.