What Body Fat Percentage Actually Measures
Body fat percentage is the share of your total body weight that is fat tissue. If you weigh 80 kg and carry 16 kg of fat, your body fat percentage is 20%. Everything else, muscle, bone, organs, water, is your lean mass.
It's a more useful number than body weight or BMI for one simple reason: it separates what you're made of from how much you weigh. Two people can weigh exactly the same and look and perform completely differently depending on how much of that weight is fat versus muscle.
Body fat also isn't a single thing. Your body carries two broad categories:
- Essential fat is the minimum needed for basic survival: it cushions organs, insulates nerves, and supports hormone production. It's roughly 2–5% in men and 10–13% in women, the difference driven by reproductive biology.
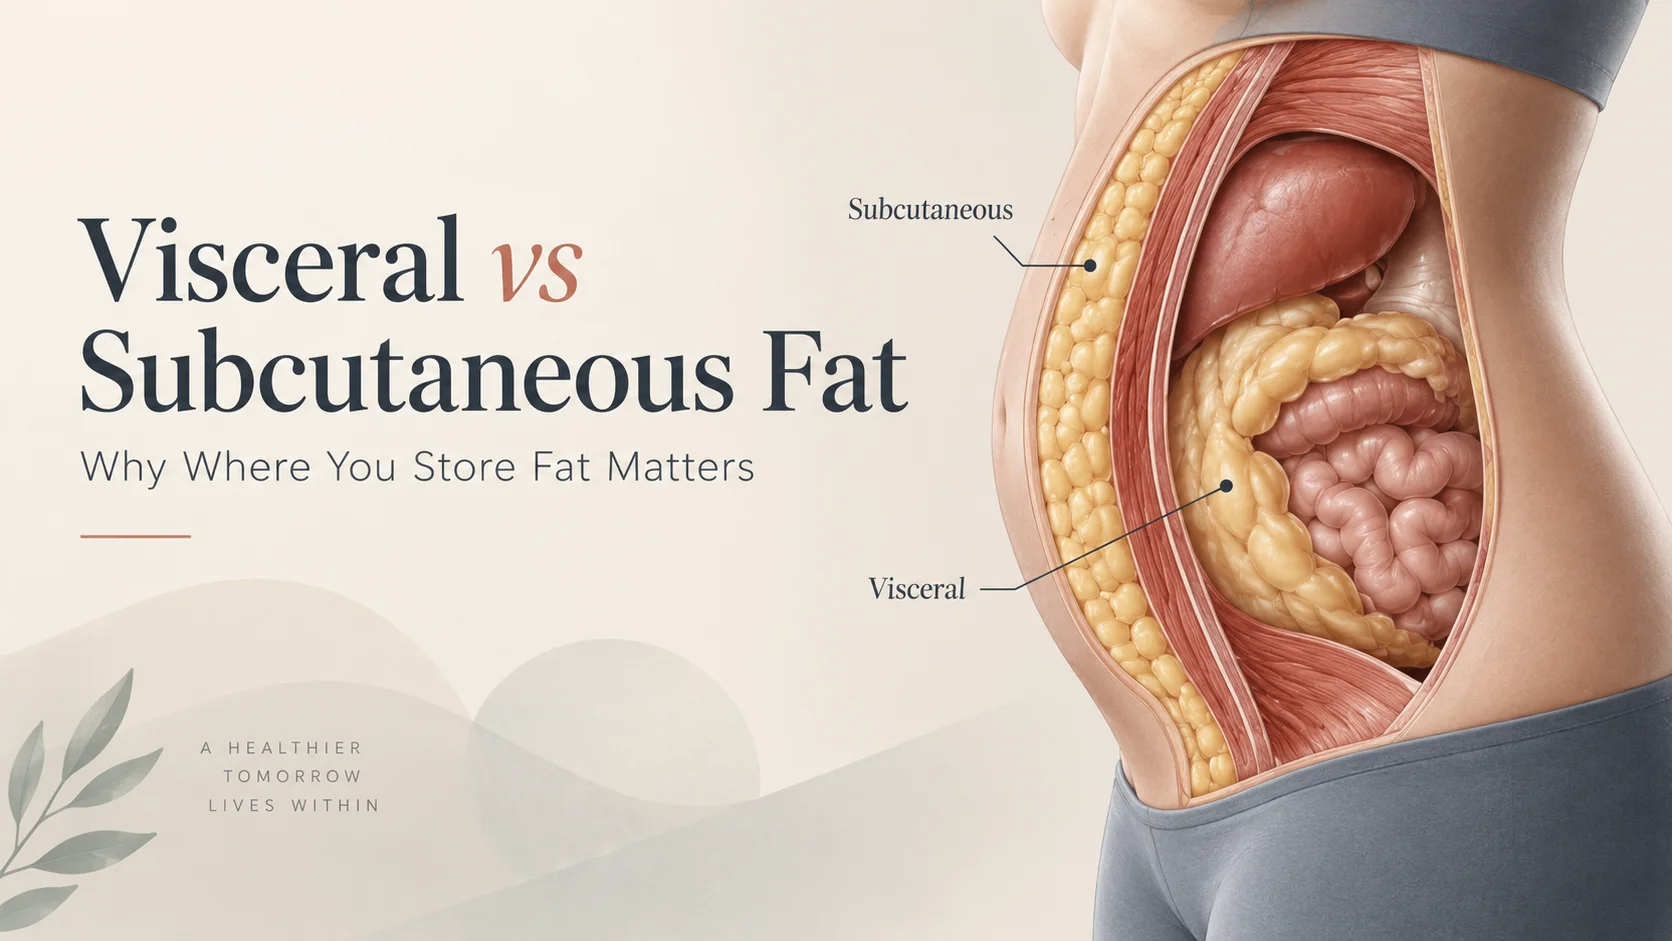
- Storage fat is everything above that. Some sits under the skin (subcutaneous), some surrounds the organs (visceral). The visceral portion is the one most strongly linked to metabolic health, which we cover in visceral vs subcutaneous fat.
Body Fat Percentage Chart (General)
The most widely cited general classification comes from the American Council on Exercise (ACE). It groups body fat into five categories regardless of age:
| Category | Women | Men |
|---|---|---|
| Essential fat | 10–13% | 2–5% |
| Athletes | 14–20% | 6–13% |
| Fitness | 21–24% | 14–17% |
| Average | 25–31% | 18–24% |
| Obese | 32%+ | 25%+ |
A few things to notice:
- Women's ranges sit roughly 8–10 points above men's in every category. This is biology, not a fitness gap.
- "Athletes" doesn't mean "ideal for everyone." Many competitive athletes sit in this range during their season and deliberately move out of it in the off-season.
- "Average" is descriptive, not a target. It reflects where a large share of the adult population sits, which in most Western countries is higher than what's associated with the best long-term health.
Body Fat Percentage Chart by Age
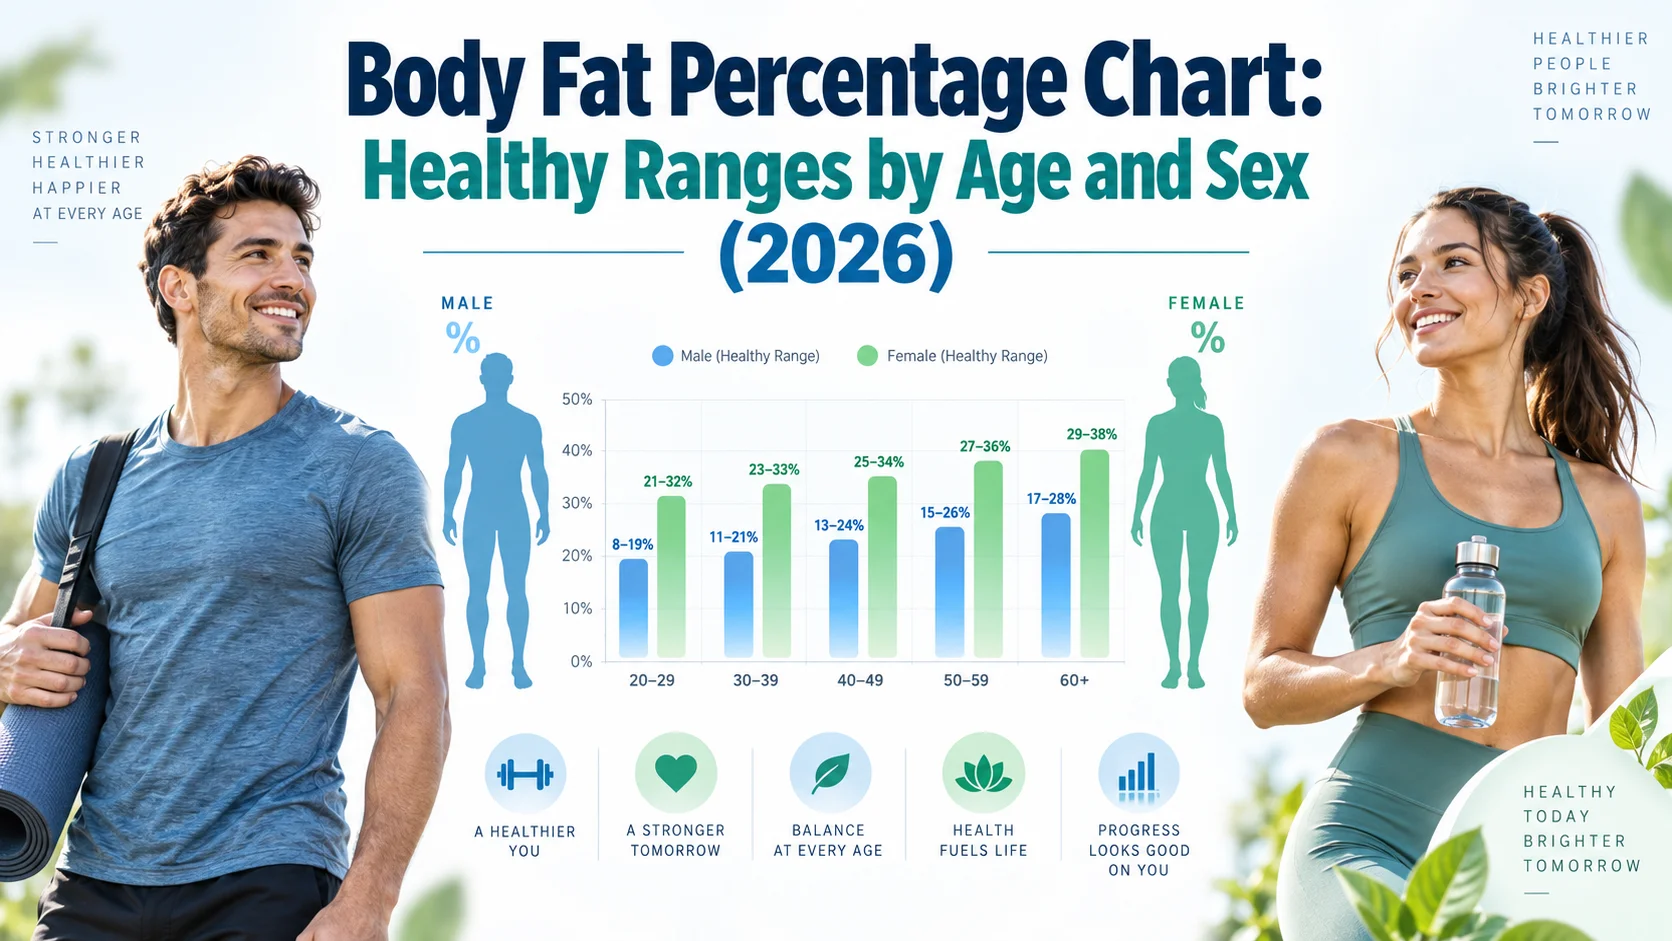
Body fat tends to rise with age even at a stable weight, partly because muscle mass gradually declines from around the fourth decade onward. Age-adjusted ranges give a fairer picture than a single chart.
The ranges below are adapted from a widely referenced study in the American Journal of Clinical Nutrition (Gallagher et al., 2000), which proposed healthy body fat ranges corresponding to a BMI of roughly 18.5–25 across age groups.
Women
| Age | Low | Healthy | High | Very high |
|---|---|---|---|---|
| 20–39 | under 21% | 21–33% | 33–39% | over 39% |
| 40–59 | under 23% | 23–34% | 34–40% | over 40% |
| 60–79 | under 24% | 24–36% | 36–42% | over 42% |
Men
| Age | Low | Healthy | High | Very high |
|---|---|---|---|---|
| 20–39 | under 8% | 8–20% | 20–25% | over 25% |
| 40–59 | under 11% | 11–22% | 22–28% | over 28% |
| 60–79 | under 13% | 13–25% | 25–30% | over 30% |
These ranges are broader than the ACE chart, and that's intentional. The Gallagher ranges are about health risk, while the ACE categories are more about fitness appearance and performance. Someone at 22% body fat in their 40s is comfortably in the healthy range on one chart and "average" on the other. Both are correct; they're answering different questions.
What Each Range Looks and Feels Like
Numbers are abstract, so here is what different ranges typically correspond to in practice. Individual variation is large, and where you store fat matters as much as how much you have.
Men
- 6–9%: Competition-stage leanness. Every muscle striation visible, veins across the abdomen. Very hard to sustain; hunger, sleep and mood typically suffer.
- 10–13%: Clearly visible abs, defined arms and shoulders, some vascularity. Achievable and maintainable for dedicated trainees.
- 14–17%: Athletic build. Upper abs may show, lower abs usually don't. Where most fit men can comfortably live year-round.
- 18–24%: Soft but not overweight. Muscle definition is hidden under a layer of fat. Typical of adults who are moderately active.
- 25%+: Noticeable fat around the waist and chest. Associated with rising metabolic risk, especially if waist circumference is also high.
Women
- 14–17%: Competition-level leanness. Very visible muscle definition. Often accompanied by disrupted menstrual cycles; not a healthy long-term target for most women.
- 18–20%: Very athletic. Abs visible, defined shoulders and legs. Sustainable for some, demanding for most.
- 21–24%: Fit and toned. Some abdominal definition, clear muscle shape in arms and legs. A realistic year-round range for active women.
- 25–31%: Healthy for most women. Curves are softer, less muscle definition, no health concern in itself.
- 32%+: Fat accumulation becomes more noticeable around the abdomen, hips and thighs. Metabolic risk rises, particularly with a high waist-to-hip ratio.
If your specific goal is visible abs, we go into the numbers and the genetics in what body fat percentage you need for abs.
Why Women Naturally Carry More Fat
The gap between male and female ranges isn't about fitness. Women's higher essential fat supports estrogen production, menstruation and pregnancy. Fat in the hips, thighs and breasts is largely sex-specific and hormonally regulated.
This matters when reading charts: a woman at 22% and a man at 12% are roughly equivalent in terms of leanness relative to their sex. Comparing raw numbers across sexes is meaningless.
It also matters for health. Research on relative energy deficiency in sport (RED-S), summarized in an International Olympic Committee consensus statement, links very low body fat and chronic under-fueling in women to loss of menstruation, reduced bone density and hormonal disruption. Very lean isn't automatically very healthy.
How to Measure Body Fat Percentage
No consumer-accessible method is perfectly accurate. Each has a margin of error, and the practical goal is to pick one method and track the trend rather than obsess over the absolute number.
| Method | Typical error | Cost | Best for |
|---|---|---|---|
| DEXA scan | ±1–2% | High (clinic) | Most accurate benchmark; also shows fat distribution |
| Hydrostatic weighing | ±1.5–2.5% | High (lab) | Research; rarely practical |
| Bod Pod (air displacement) | ±2–3% | Medium (clinic) | Accurate, comfortable alternative to hydrostatic |
| Skinfold calipers | ±3–5% | Low | Consistent tracking when done by the same skilled person |
| Bioelectrical impedance (BIA) | ±3–8% | Low (smart scales, handhelds) | Convenient; hydration swings the result a lot |
| Navy tape method | ±3–4% | Free | Surprisingly good for tracking at home |
| Visual estimation | ±5%+ | Free | Rough ballpark only |
DEXA (dual-energy X-ray absorptiometry)
The clinical gold standard for body composition. It uses two low-dose X-ray beams to separate bone, lean tissue and fat, and reports regional distribution (arms, legs, trunk). It's the best option if you want a single accurate baseline, but scans typically cost money and results still vary by a percent or two depending on hydration and the machine's software.
Bioelectrical impedance (smart scales)
BIA sends a tiny current through the body and estimates fat from how much resistance it meets, since fat conducts poorly and water-rich muscle conducts well. It's cheap and convenient, but the reading swings with hydration, meal timing, exercise and even foot temperature. A smart scale can easily show a 3–4 point difference between morning and evening on the same day.
If you use one, weigh at the same time every morning after using the bathroom and before eating or drinking, and look at the weekly average, not individual readings.
Skinfold calipers
Calipers pinch skin and fat at several sites (typically three or seven), and the measurements are run through an equation such as the Jackson-Pollock formula. In experienced hands they're consistent; in inexperienced hands they're close to random. The trick is that the same person measures the same sites the same way each time, so the trend is reliable even if the absolute number isn't.
The U.S. Navy tape method
Developed by the Navy for fitness assessments, this method needs only a tape measure. It uses waist, neck and height for men, and waist, hip, neck and height for women. Studies comparing it to DEXA have found it performs reasonably well for most body types, with larger errors at very high and very low body fat levels.
The formulas (measurements in centimeters):
- Men: %BF = 495 / (1.0324 − 0.19077 × log10(waist − neck) + 0.15456 × log10(height)) − 450
- Women: %BF = 495 / (1.29579 − 0.35004 × log10(waist + hip − neck) + 0.22100 × log10(height)) − 450
Measure the waist at the navel for men and at the narrowest point for women, the neck just below the larynx, and the hips at the widest point. Consistency matters more than perfection.
We walk through each of these home methods step by step in how to measure body fat at home.
Body Fat vs BMI: Which Should You Use?
BMI is calculated purely from height and weight. It's useful for population statistics because it's easy to collect, but it can't tell muscle from fat. A 90 kg man at 180 cm has a BMI of 27.8, "overweight," whether he's a rugby player at 12% body fat or a sedentary office worker at 30%.
Body fat percentage fixes that specific blind spot. But it has its own limitation: it says nothing about where the fat is. Two people at 25% body fat can have very different health profiles if one carries it mostly around the organs and the other mostly under the skin.
For most people the practical answer is:
- Use body fat percentage to track changes in composition over time
- Use waist circumference (or waist-to-height ratio) as a quick check on visceral fat and metabolic risk
- Treat BMI as a rough screening number, nothing more
We compare the two measures in detail in BMI vs body fat percentage.
How to Lower Body Fat Percentage
There are only two ways to lower the percentage: lose fat, or gain lean mass. Doing both at once is called body recomposition, and it's most realistic for beginners, people returning after a break, and those carrying a fair amount of fat to begin with.
The evidence-based fundamentals haven't changed much:
- A moderate calorie deficit. Roughly 300–500 kcal below maintenance is generally sustainable and preserves muscle better than aggressive cuts. Losing more than about 1% of body weight per week tends to increase muscle loss.
- Adequate protein. Around 1.6–2.2 g per kg of body weight, supported by a 2018 meta-analysis in the British Journal of Sports Medicine and the International Society of Sports Nutrition's position stand. Protein is what tells your body to keep the muscle while it burns the fat.
- Resistance training. Lifting gives your body a reason to hold onto muscle in a deficit. Two to four sessions a week is enough for most people.
- Daily movement. Step count and general activity account for a surprisingly large share of total energy expenditure. Walking is underrated.
- Sleep. A 2010 study in the Annals of Internal Medicine found that people sleeping 5.5 hours lost significantly more lean mass and less fat on the same diet compared with those sleeping 8.5 hours.
Tracking what you actually eat matters more than which diet you pick. Consistent food logging is one of the best-supported predictors of fat-loss success, and modern tools have removed most of the friction: photo-based apps like CalSensei estimate calories and macros from a picture of your plate, which is especially useful for home-cooked and mixed dishes that don't come with a label. The method matters less than doing it consistently.
For a full step-by-step approach to losing fat while gaining or keeping muscle, see our body recomposition guide.
How Fast Can Body Fat Percentage Change?
Slower than most people expect, and slower than most social media suggests.
For someone starting around 25–30% body fat, losing 0.5–1% of body fat per month is a realistic pace with consistent effort. Leaner individuals progress more slowly; going from 15% to 10% is typically harder and slower than going from 25% to 20%.
Measurement noise is larger than weekly change. A smart scale's day-to-day swing of 2–3 points is bigger than a month of real progress, which is why single readings are meaningless and trends over 4–8 weeks are what you should watch.
Frequently Asked Questions
What is a healthy body fat percentage?
For most adults, roughly 21–33% for women and 8–20% for men in their 20s and 30s, with the healthy range shifting slightly higher with age. Fitness-oriented targets are lower: 21–24% for women and 14–17% for men is often described as "fit."
What body fat percentage is considered obese?
The ACE classification uses 32% and above for women and 25% and above for men. Age-adjusted health guidelines set the threshold a little higher for older adults.
Is 15% body fat good for a man?
Yes. Fifteen percent falls in the "fitness" category for men and is a comfortable, sustainable level with visible muscle definition and no health concerns for most people.
Is 25% body fat good for a woman?
Yes. Twenty-five percent is at the boundary between "fitness" and "average" on the ACE chart and well within the healthy range on age-adjusted guidelines.
Which body fat measurement is most accurate?
DEXA is the most accurate widely available method. For home use, the Navy tape method and skinfold calipers offer the best balance of accuracy and convenience, provided you measure consistently.
Why does my smart scale give a different body fat reading every day?
Bioelectrical impedance is sensitive to hydration, meals, exercise and time of day. Weigh under the same conditions each morning and use a weekly average to filter the noise.
Can you have a normal BMI but high body fat?
Yes. This is sometimes called "normal-weight obesity" and is more common than people assume, particularly in people with low muscle mass. It's one of the main reasons body fat percentage is a more informative measure than BMI alone.
This article is for general educational purposes and is not a substitute for individualized medical advice. Body fat targets vary with age, health status and activity. If you have a medical condition or a history of disordered eating, consult a qualified healthcare professional before pursuing body composition changes.
Sources
- American Council on Exercise. Percent body fat norms for men and women.
- Gallagher D, et al. Healthy percentage body fat ranges: an approach for developing guidelines based on body mass index. American Journal of Clinical Nutrition, 2000.
- Mountjoy M, et al. IOC consensus statement on relative energy deficiency in sport (RED-S): 2018 update. British Journal of Sports Medicine, 2018.
- Morton RW, et al. A systematic review, meta-analysis and meta-regression of the effect of protein supplementation on resistance training-induced gains in muscle mass and strength. British Journal of Sports Medicine, 2018.
- Jäger R, et al. International Society of Sports Nutrition Position Stand: protein and exercise. Journal of the International Society of Sports Nutrition, 2017.
- Nedeltcheva AV, et al. Insufficient sleep undermines dietary efforts to reduce adiposity. Annals of Internal Medicine, 2010.
- Hodgdon JA, Beckett MB. Prediction of percent body fat for U.S. Navy men and women from body circumferences and height. Naval Health Research Center, 1984.